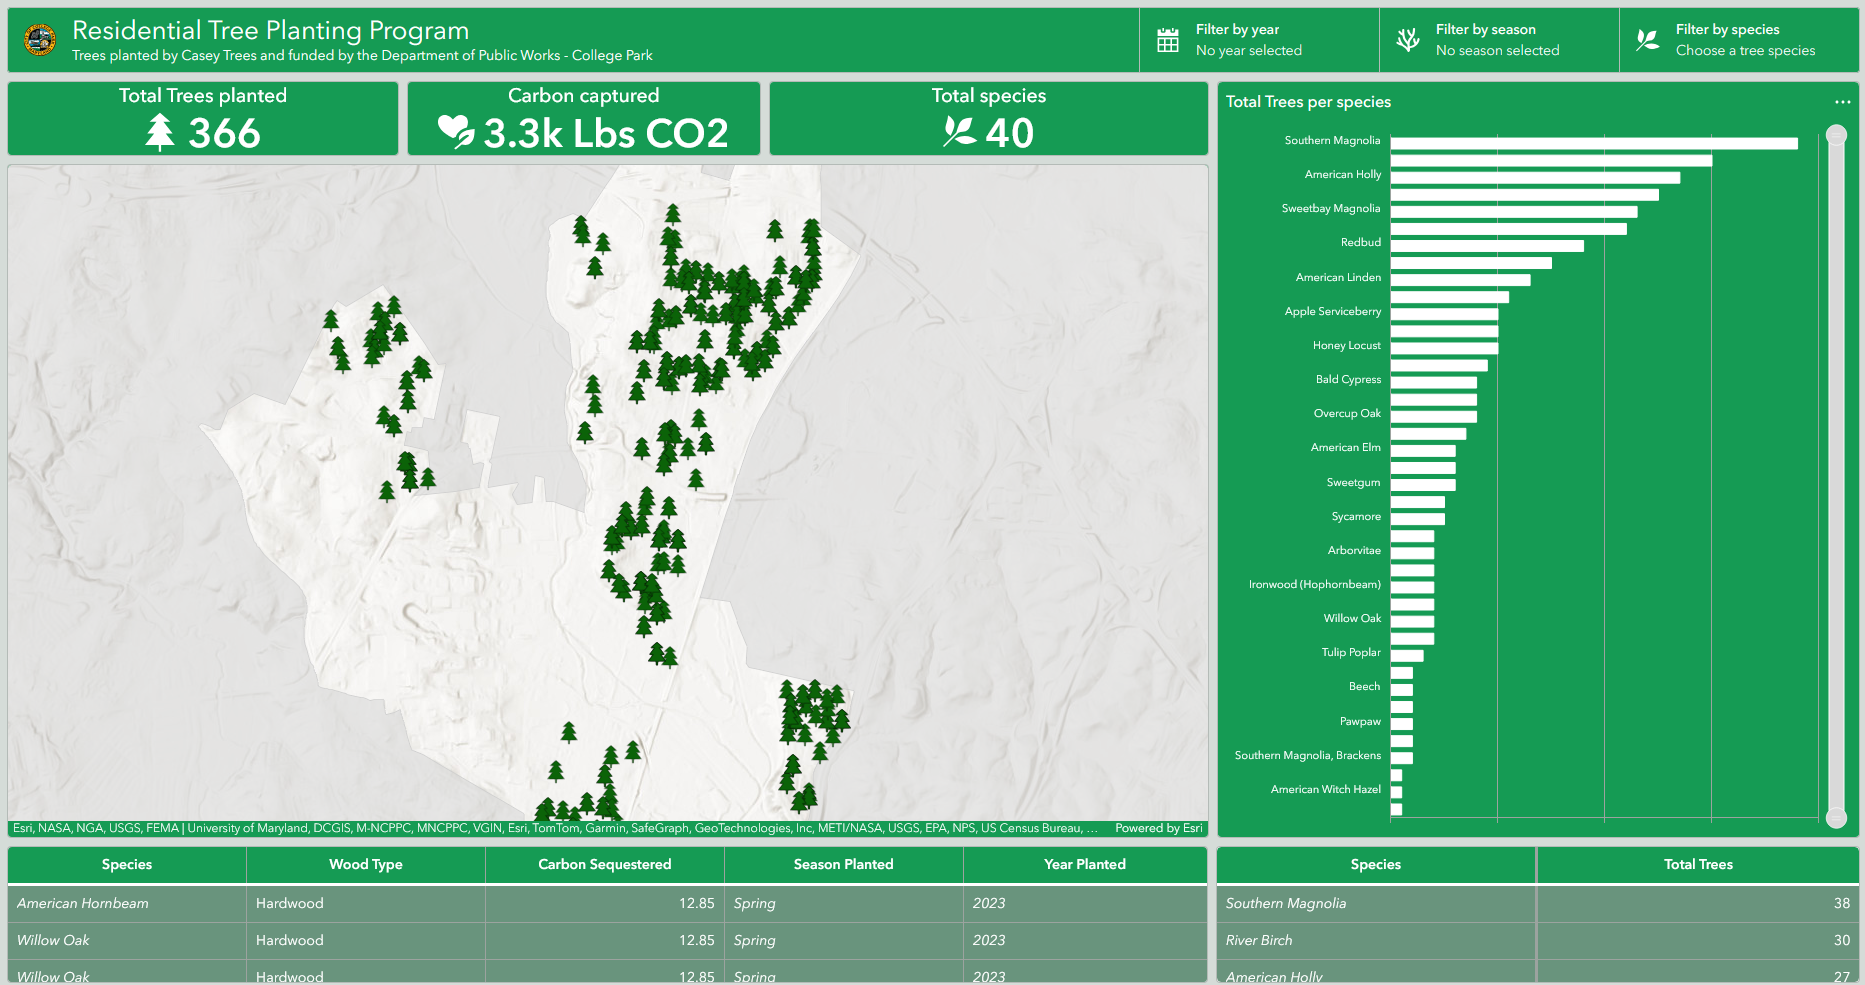
Tree Planting & Carbon Tracking
An ArcGIS Dashboard monitoring urban reforestation with automated carbon capture estimation.
- Python-driven environmental impact metrics.
- Real-time spatial tracking of municipal planting.
I am an experienced Geospatial Professional with vast experience processing geographic data, developing geospatial models, managing geospatial databases, and creating interactive maps and data visualizations to support global development, environmental initiatives, and business endeavors.

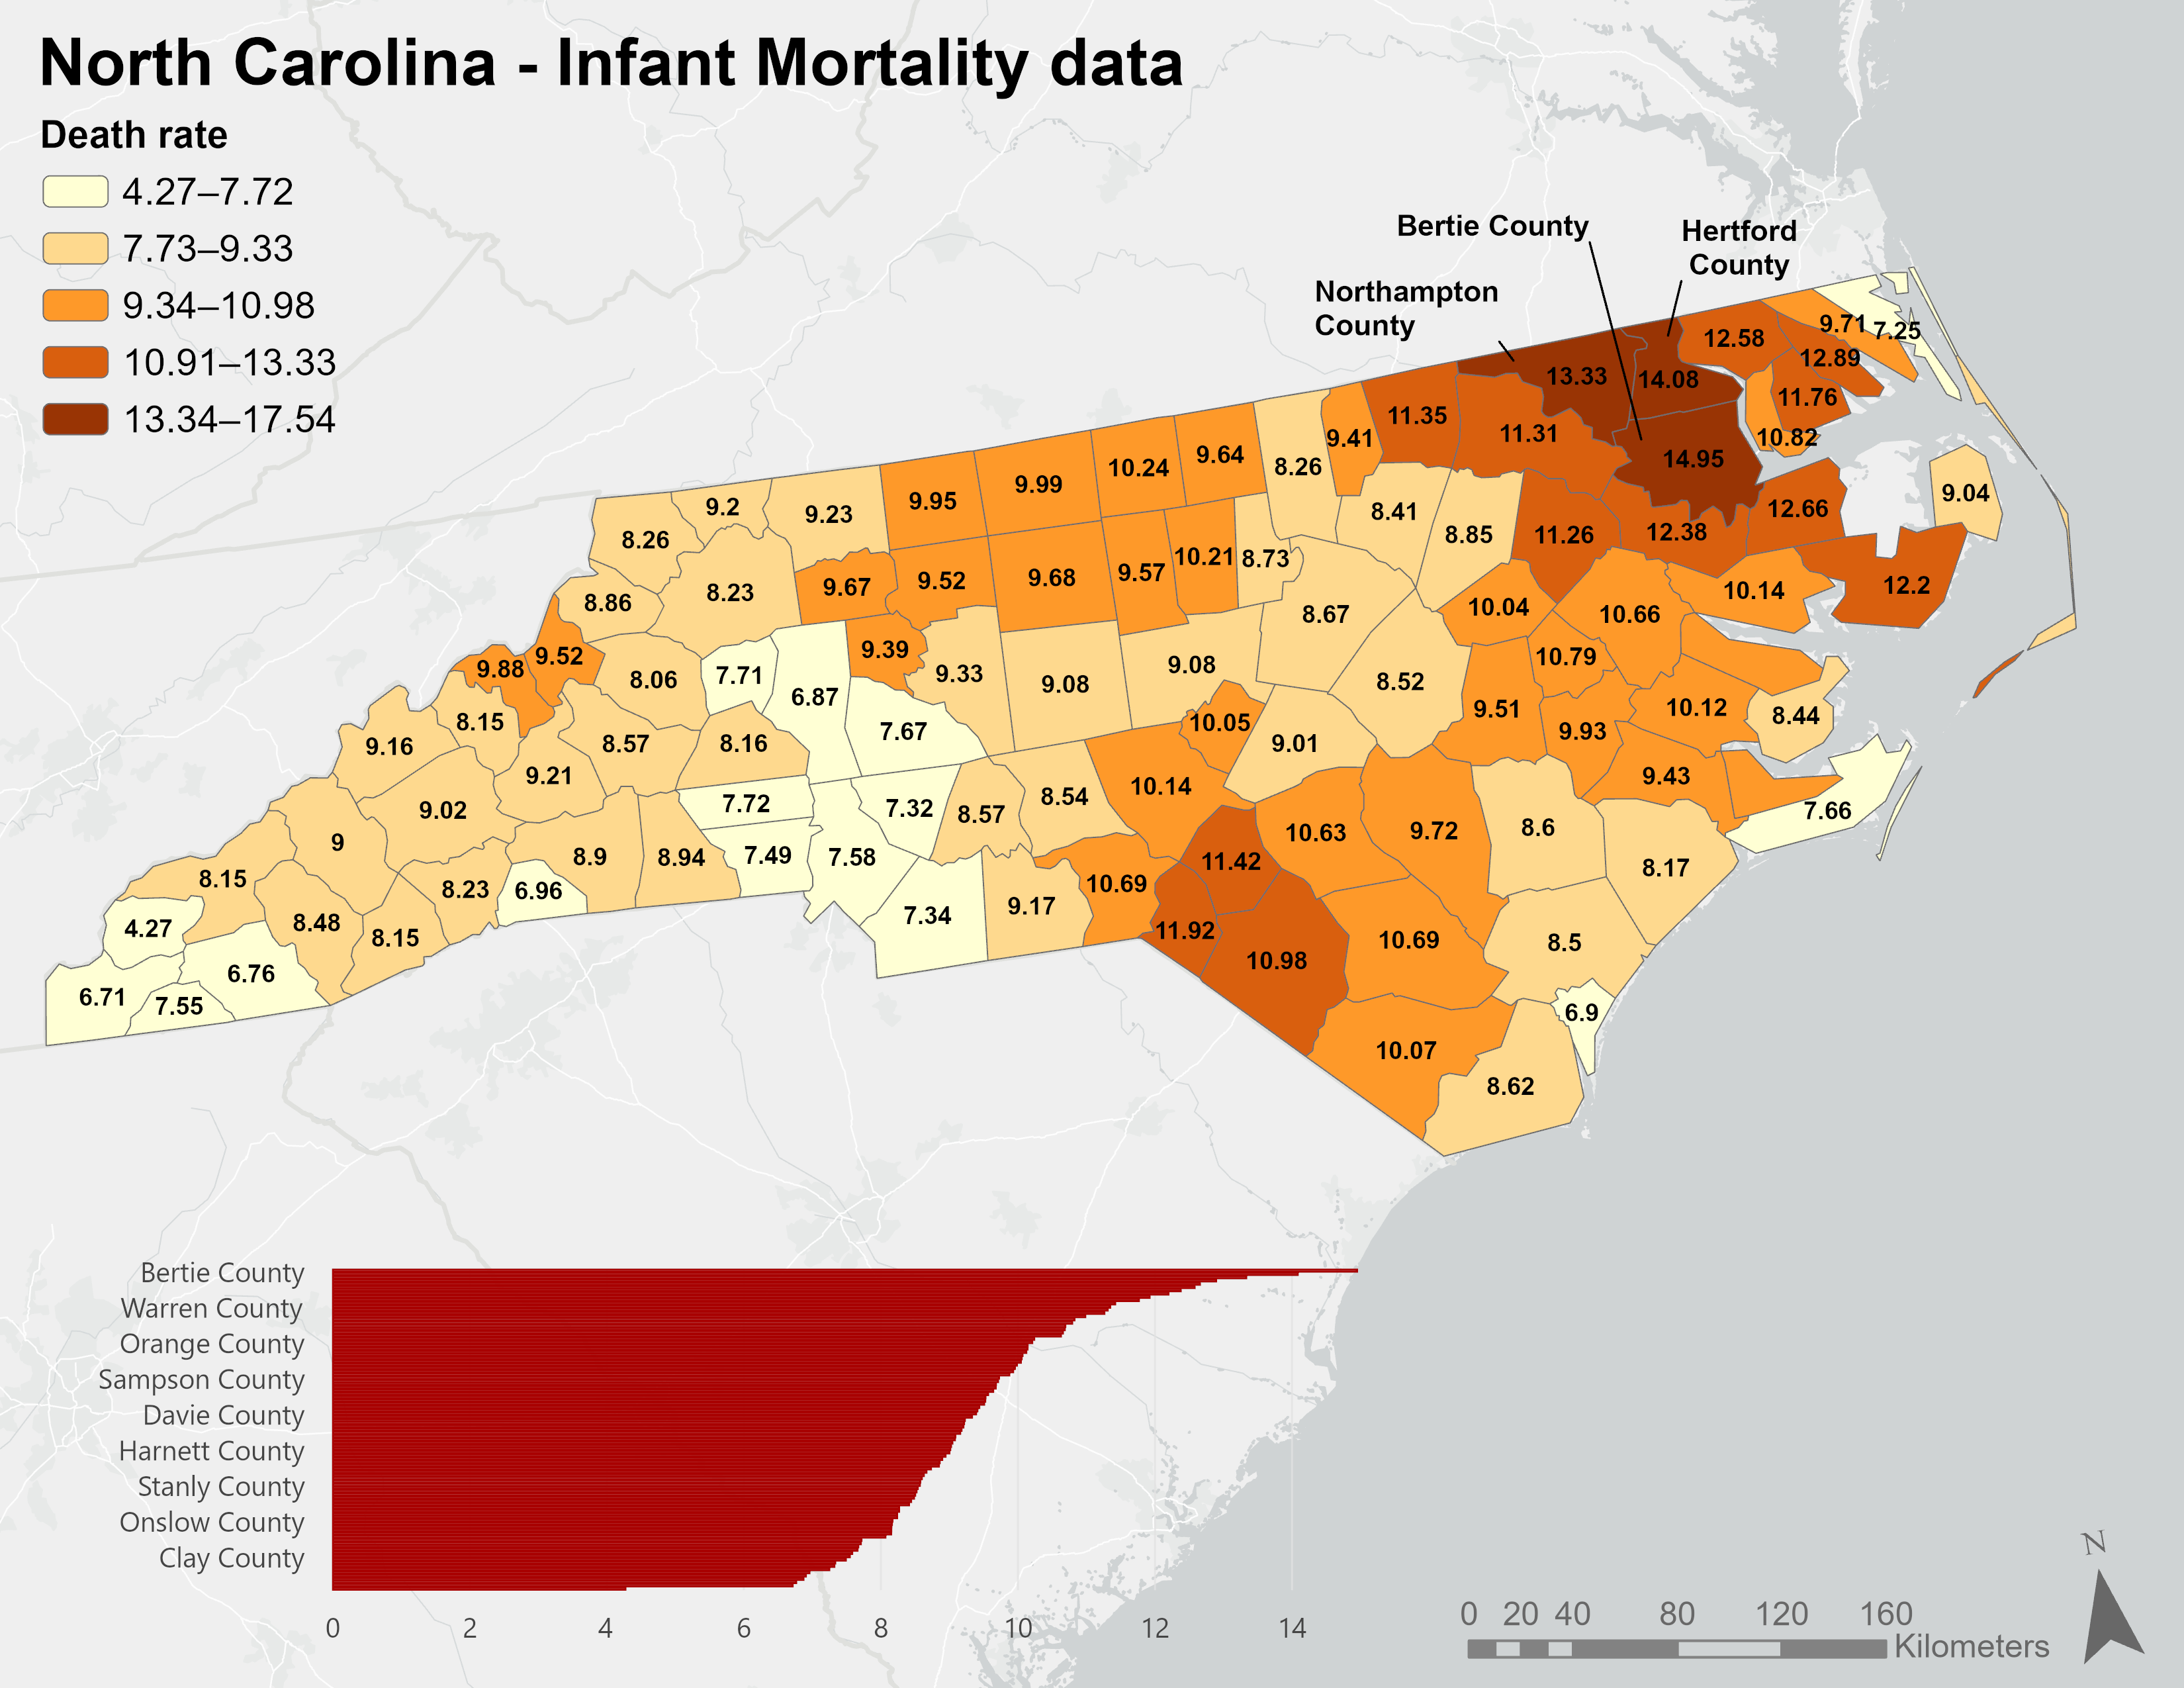
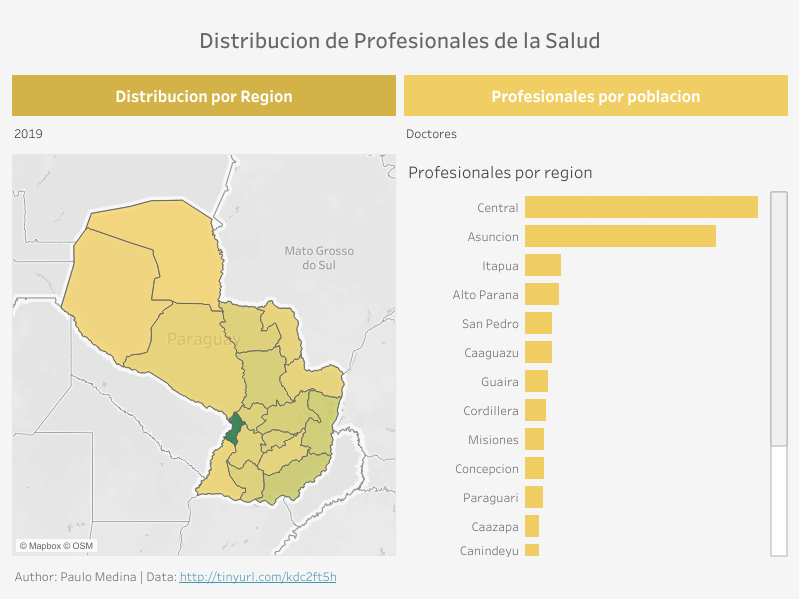
I'm a Forestry Engineer completing my M.S. in GIS at the University of Maryland this spring. My career has taken me from forest inventory work to modeling public health indicators across Sub-Saharan Africa—always with one constant: using spatial data to solve problems that matter.
I've worked with multidisciplinary teams across continents, turning messy GPS datasets and survey data into clear insights that inform real decisions. Whether it's mapping health outcomes for local governments or managing geospatial databases for development programs, I'm drawn to work where precision meets purpose.
Currently expanding into cloud infrastructure (training for AWS Solutions Architect certification) to build more scalable geospatial solutions. I'm looking for my next role with organizations that use data and technology to create measurable impact—where the mission is as important as the method.
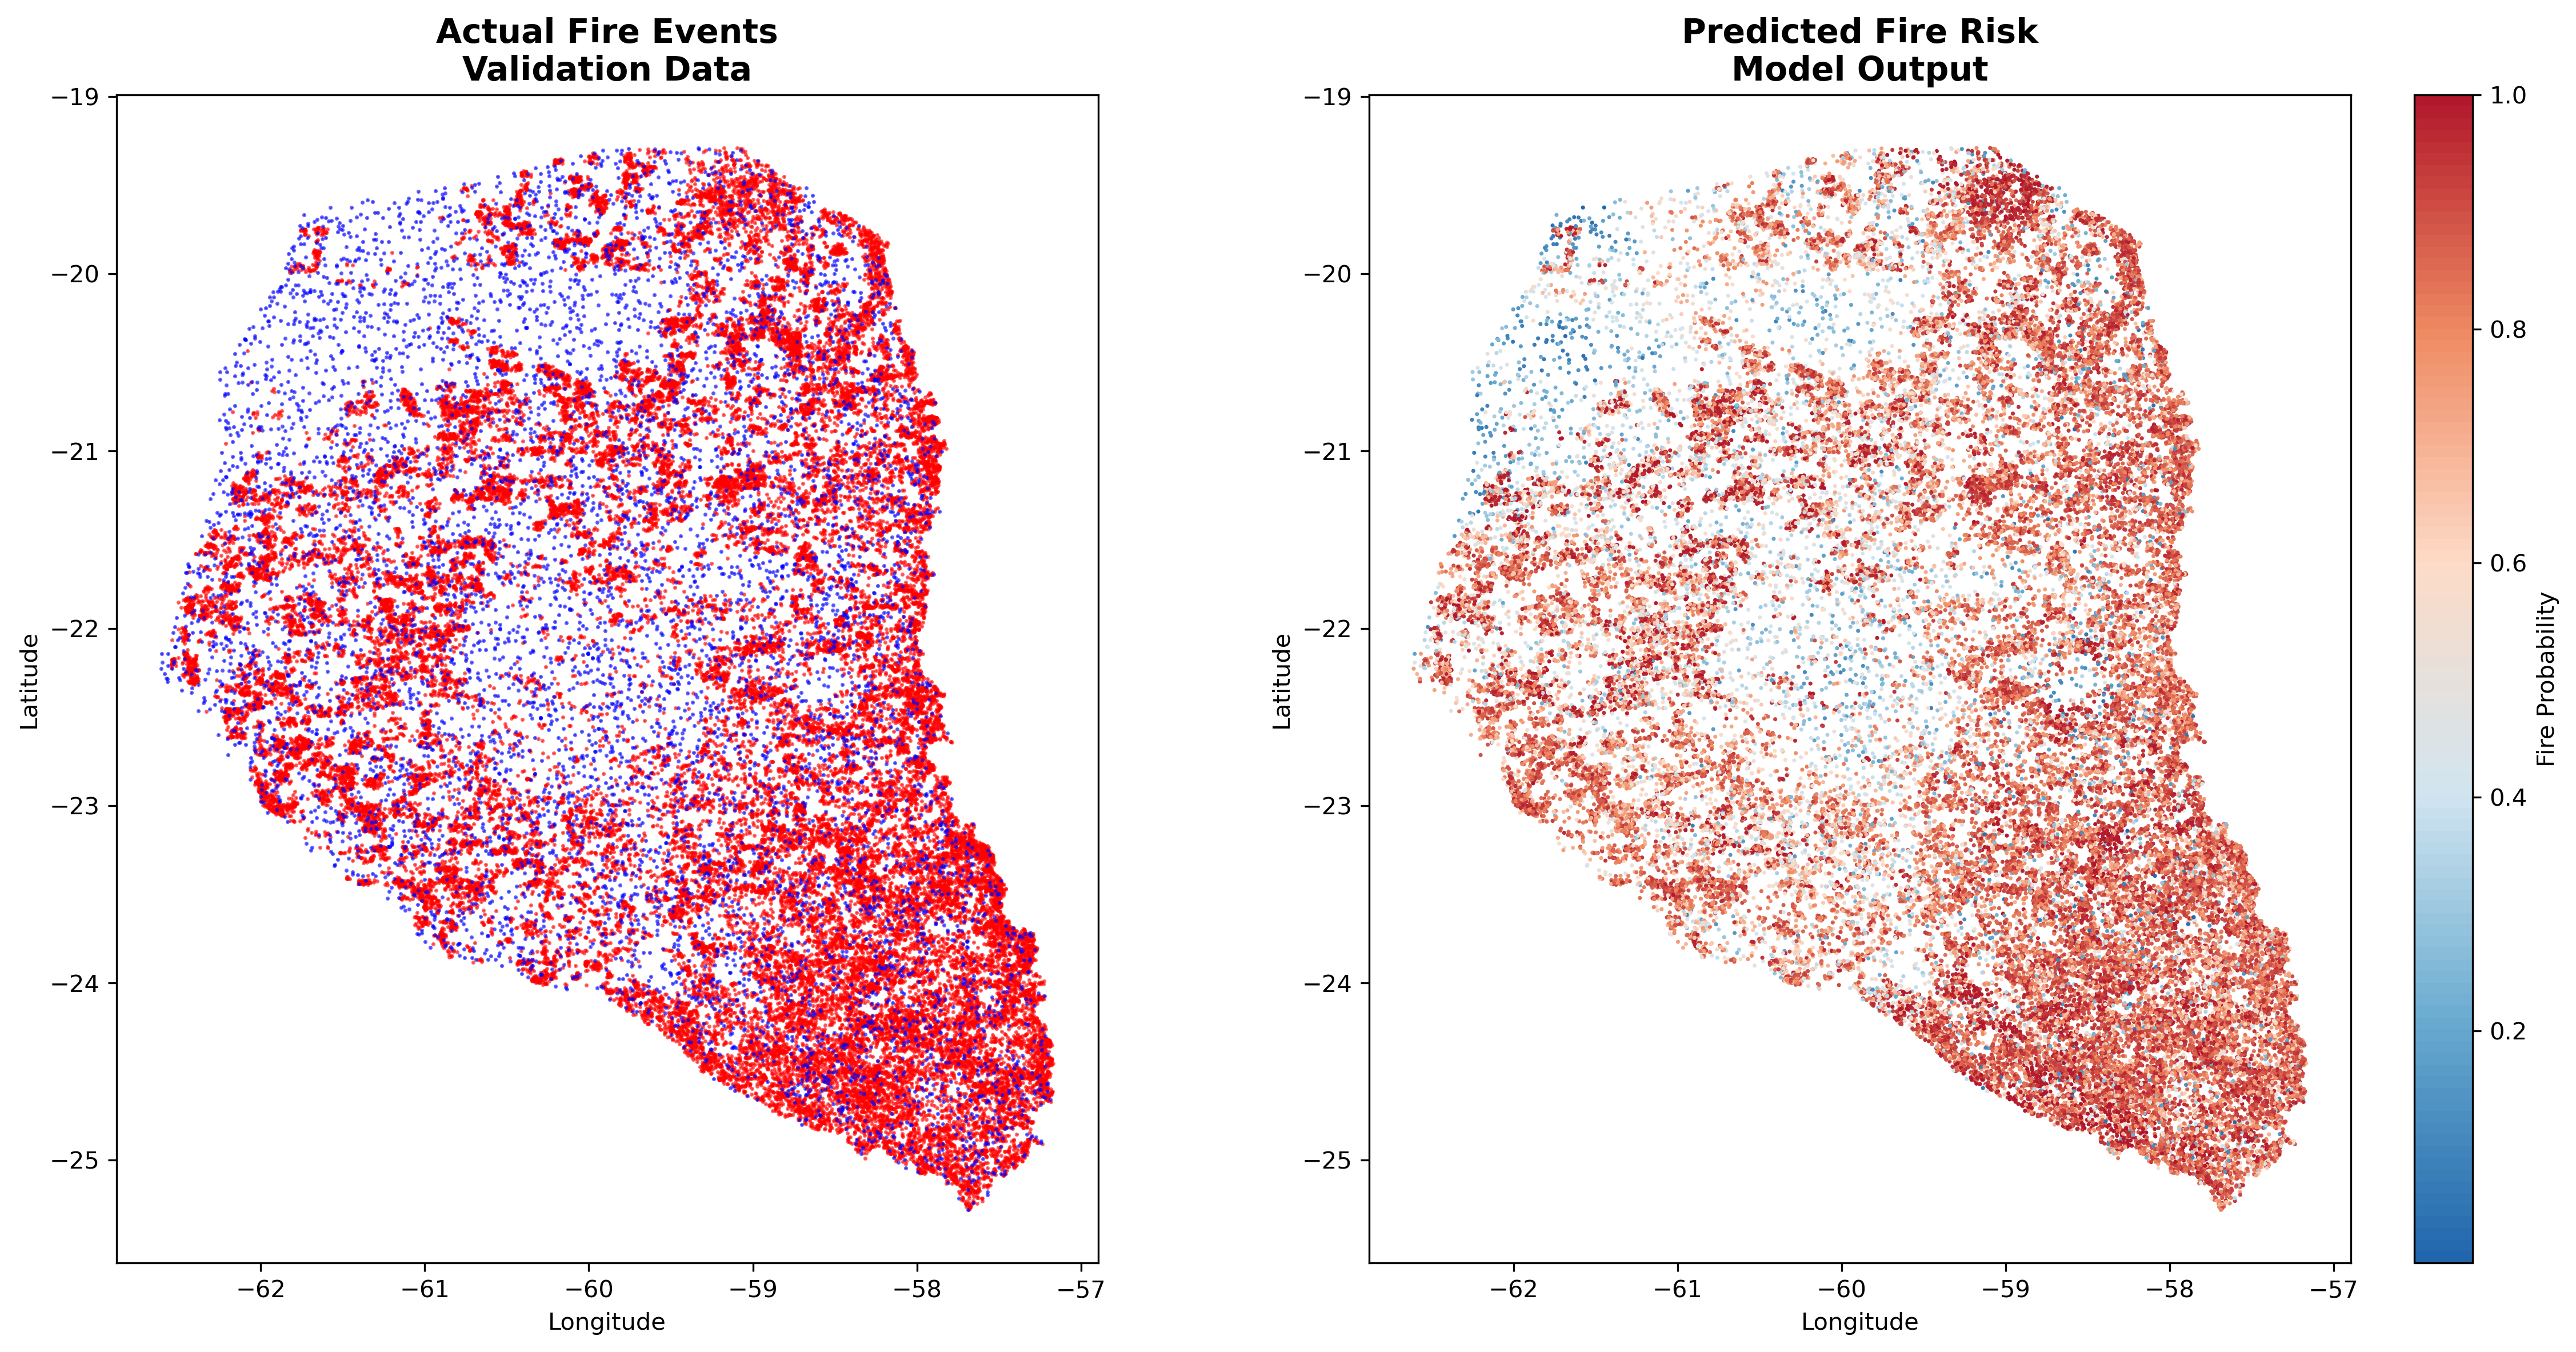
A predictive modeling project utilizing Random Forest to estimate daily wildfire likelihood. By integrating 24 years of FIRMS data with climate and topographic variables, this tool provides a robust framework for early-warning systems.
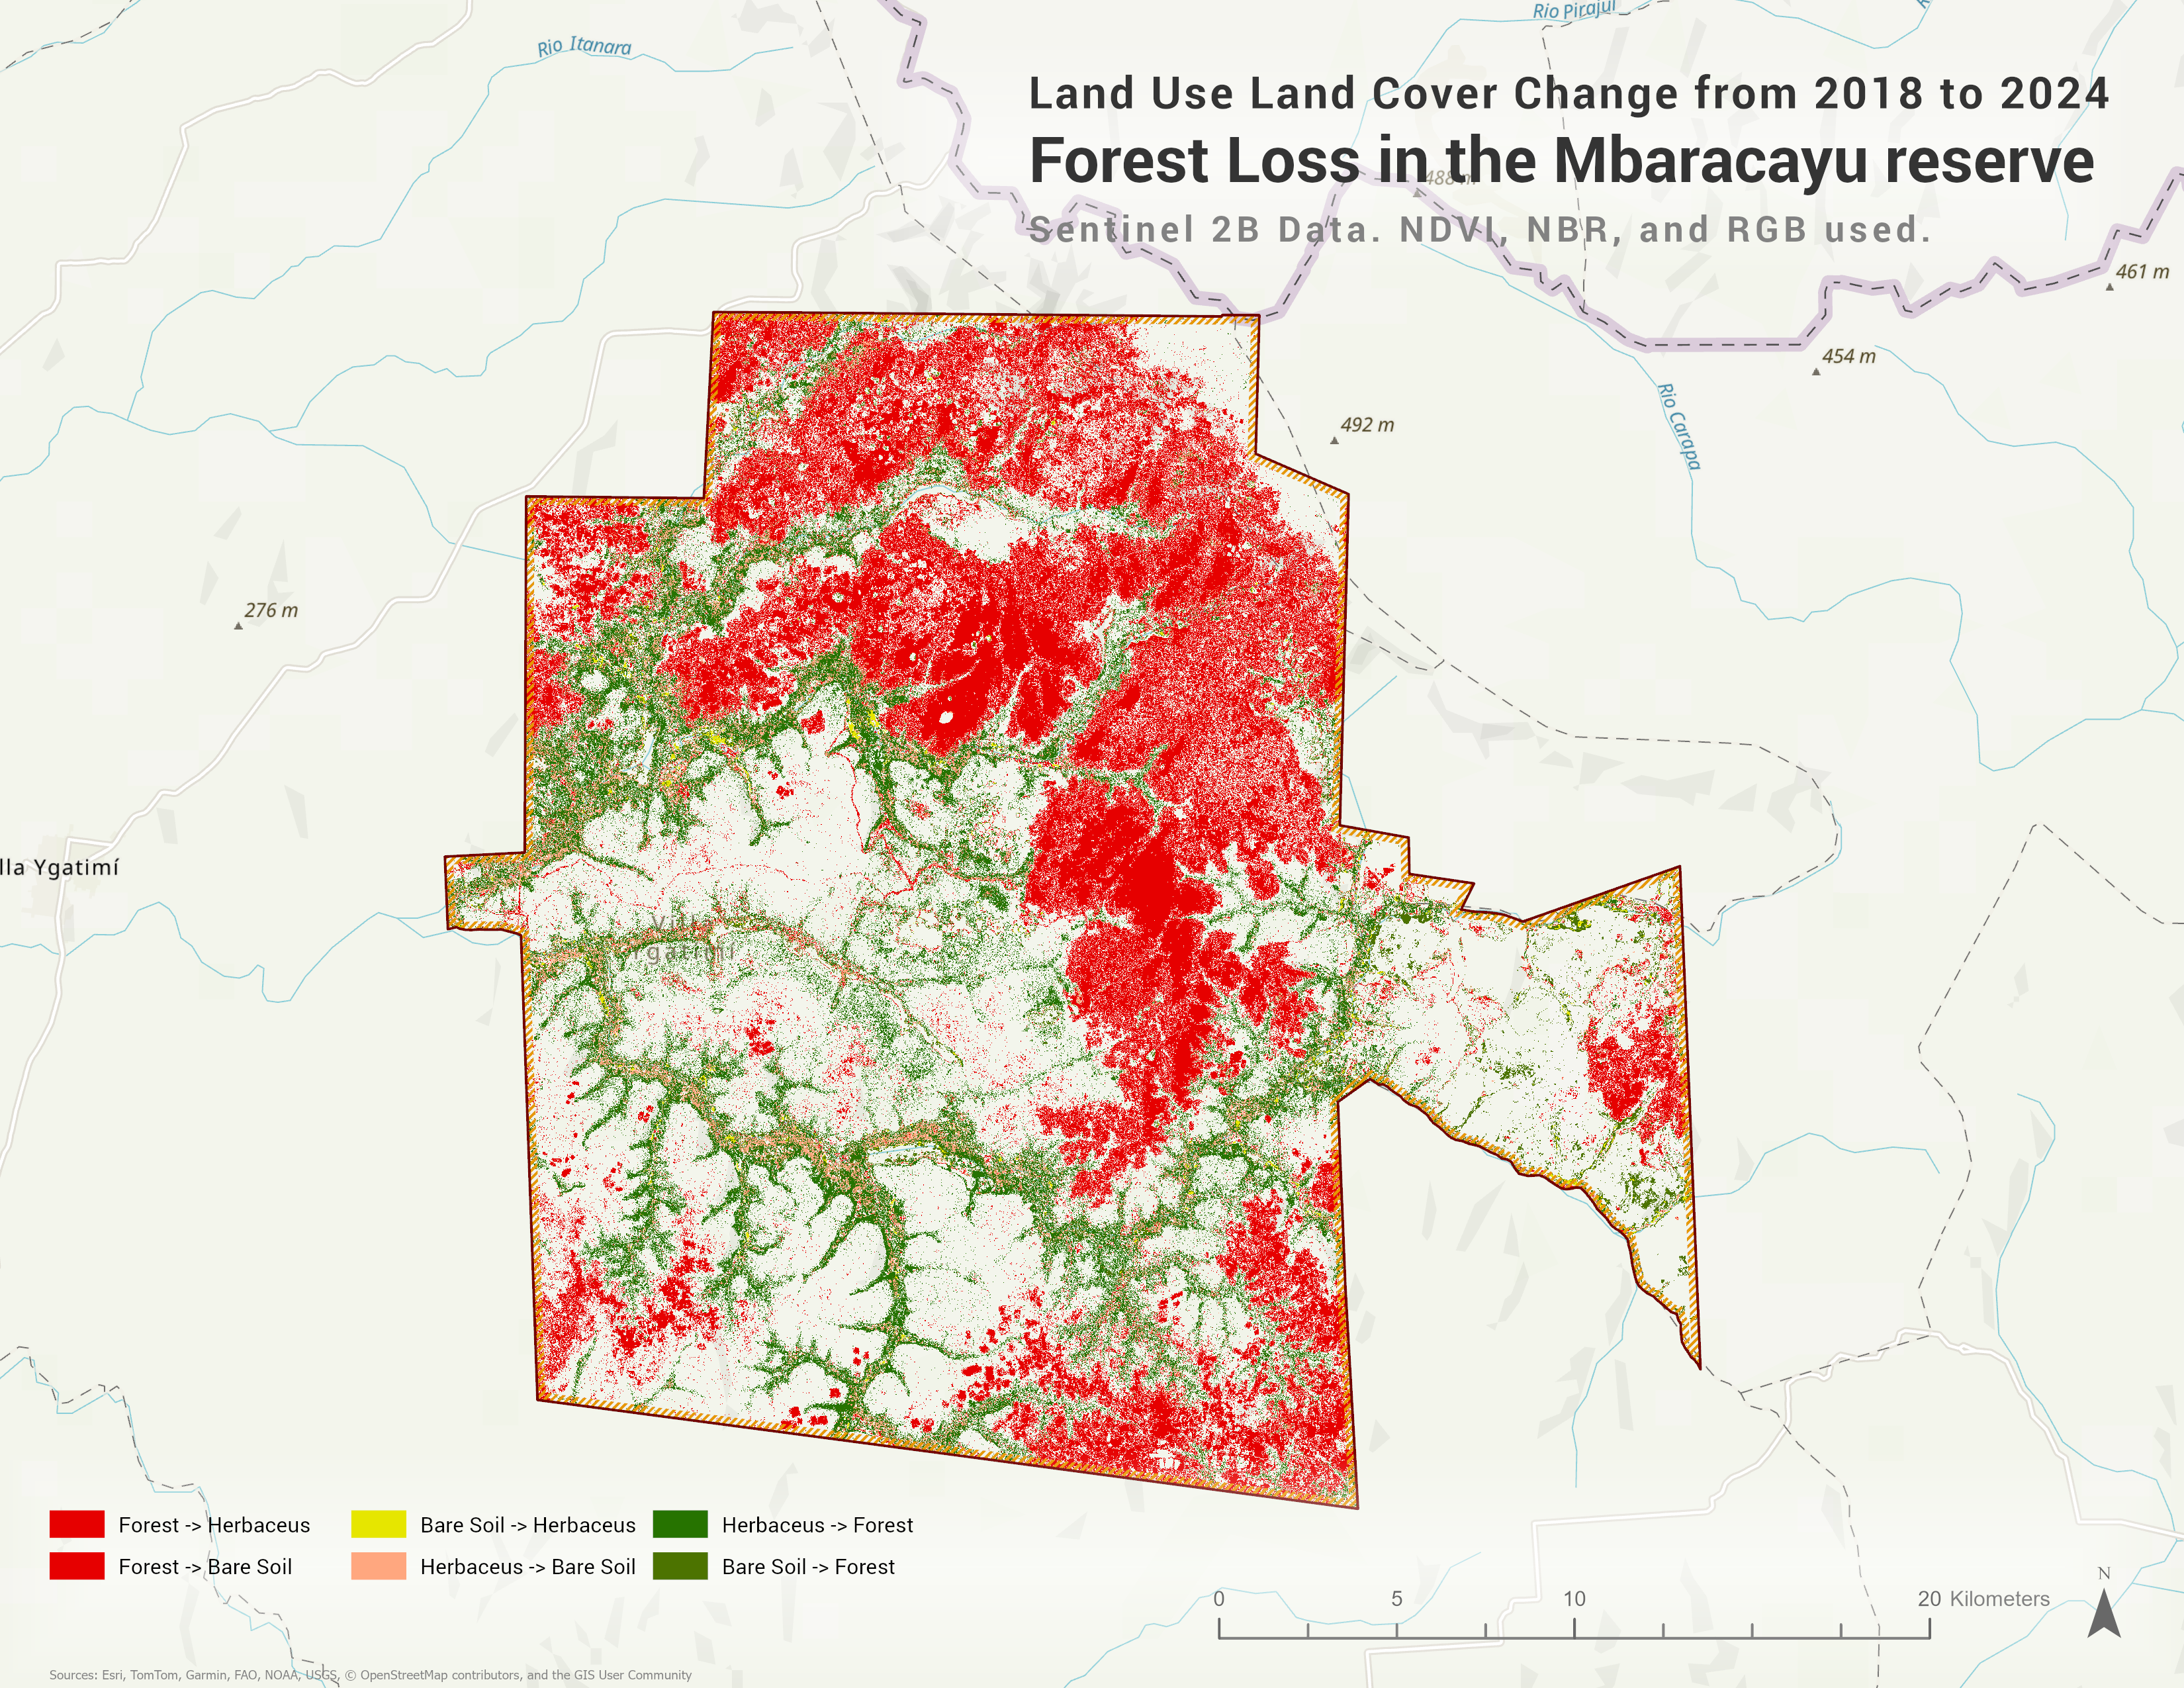
An analysis of illegal logging and wildfire impacts using Sentinel-2A multispectral data. This study quantified over 19,000 hectares of forest disturbance using NDVI and NBR indices to identify land-cover transitions.
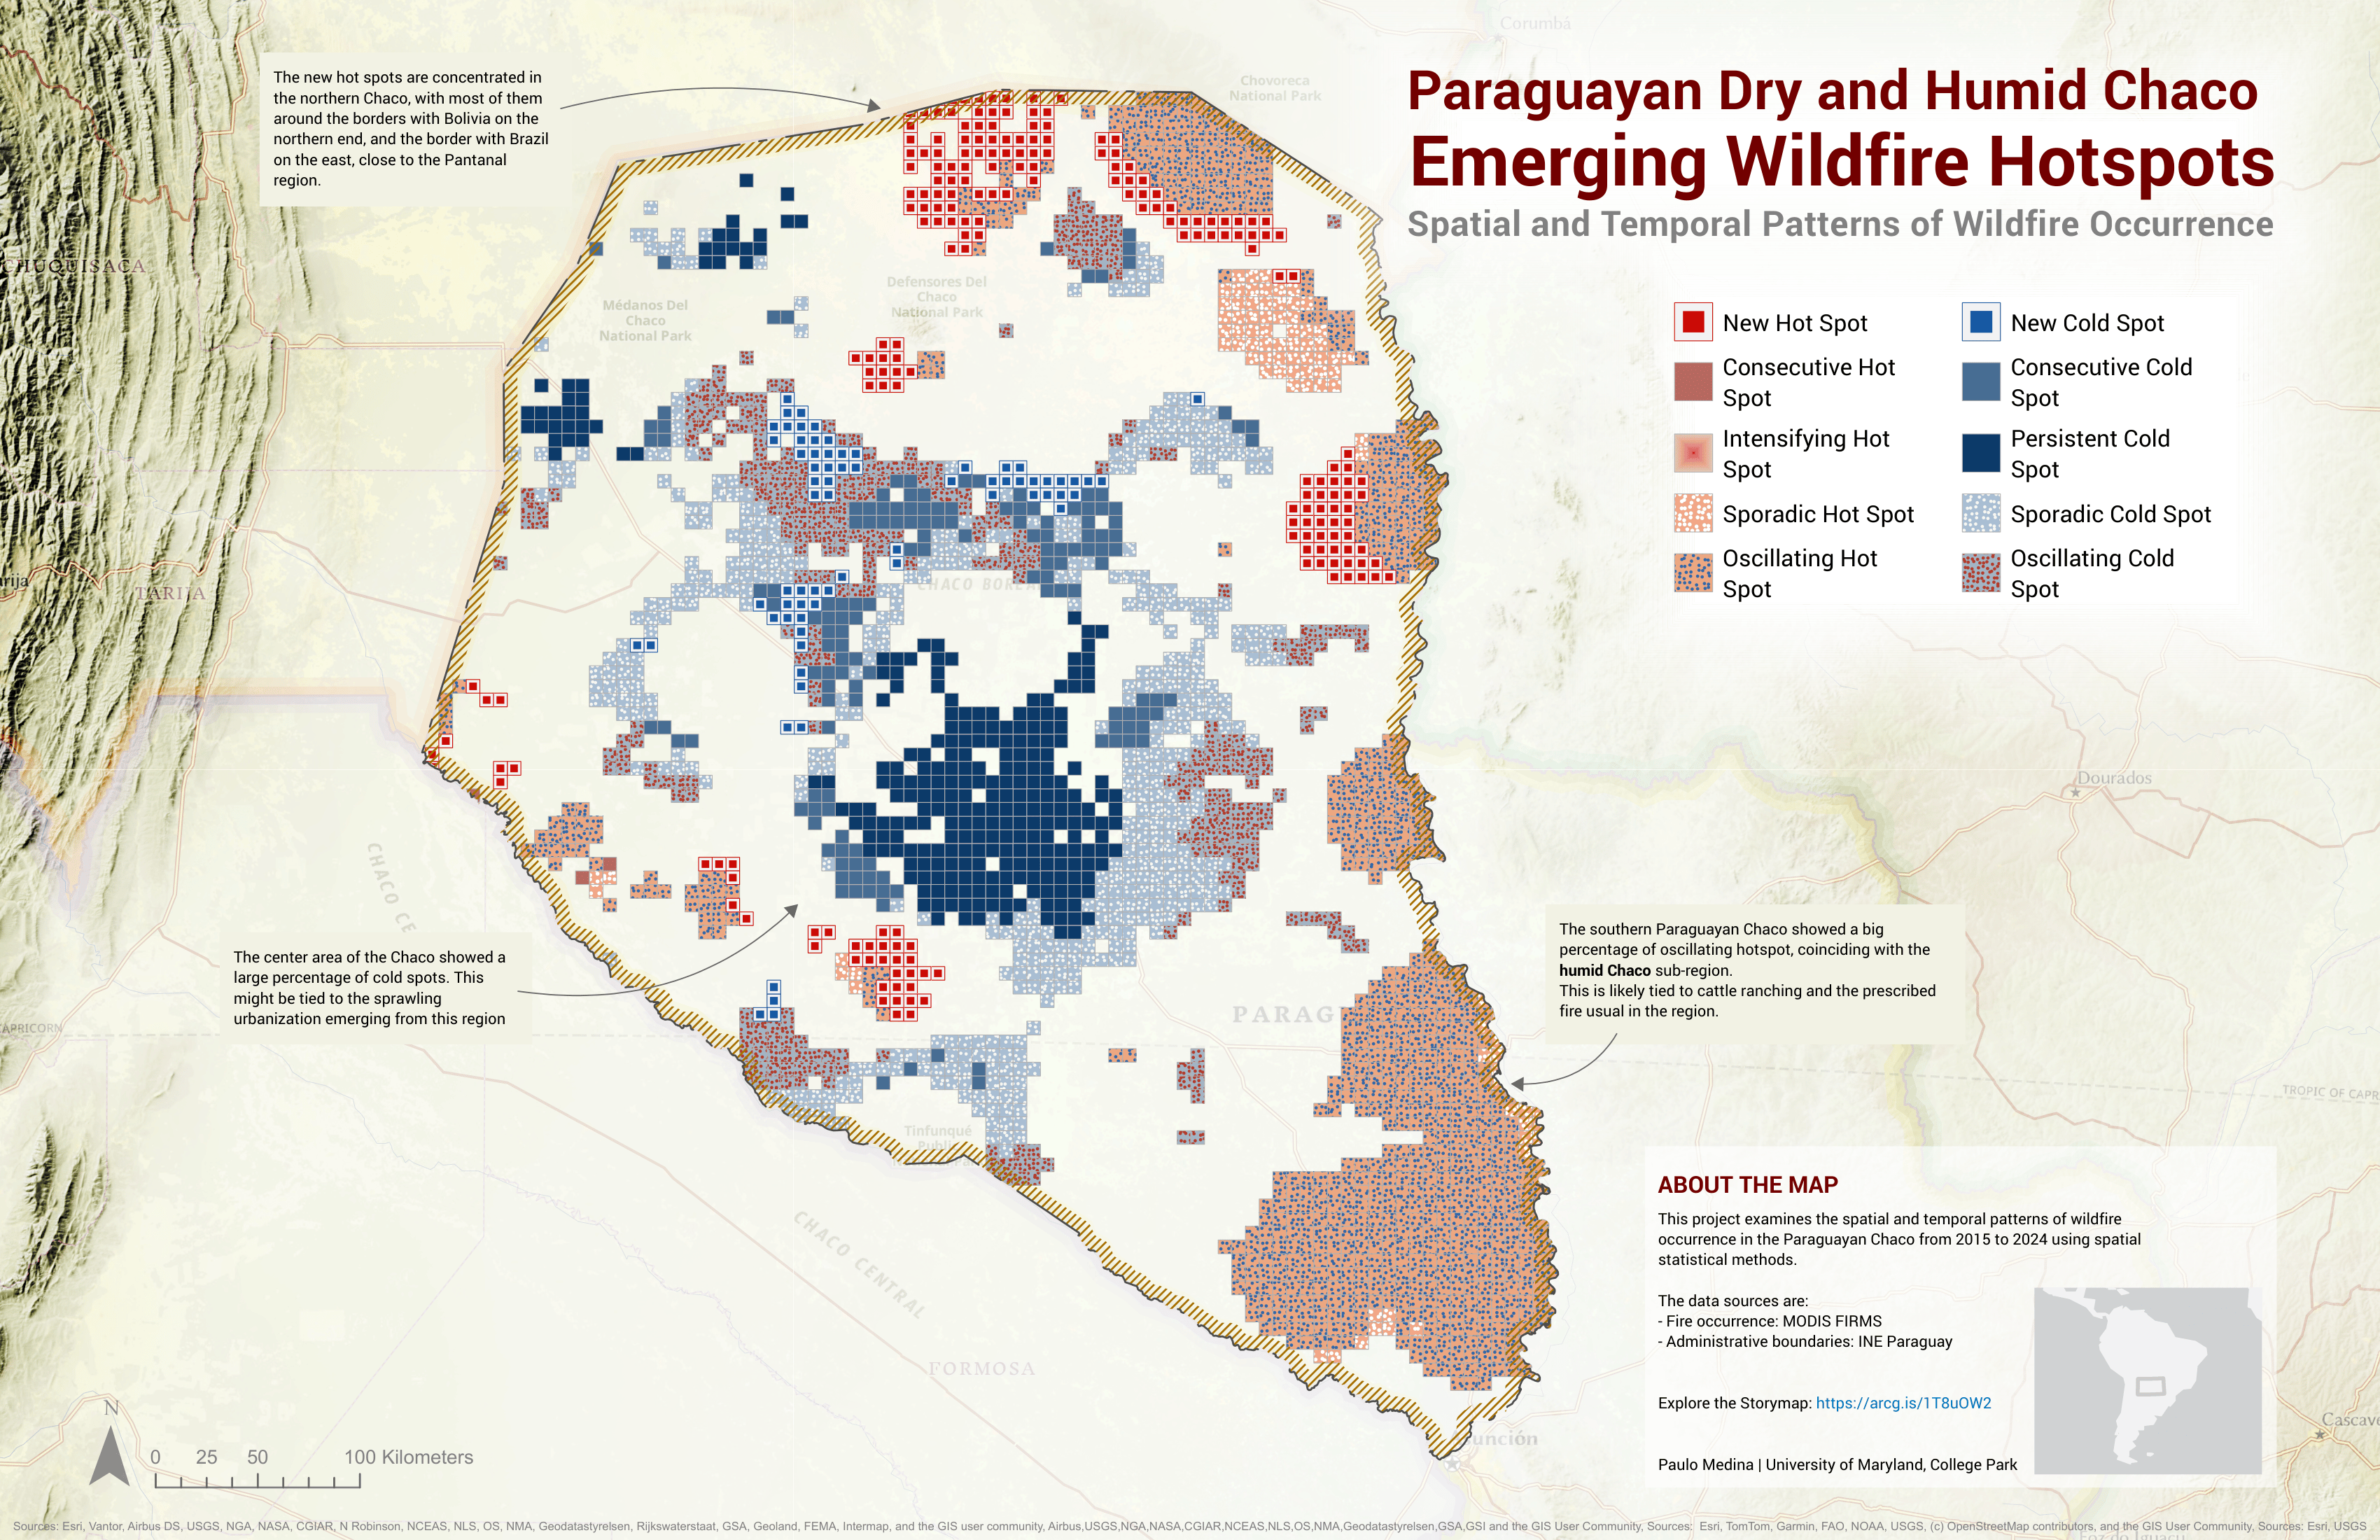
An overview of spatio-temporal patterns of wildfires in the Paraguayan Chaco. The analysis took historical fire data from MODIS and analyzed clustering, covariance, and emerging hotspots.
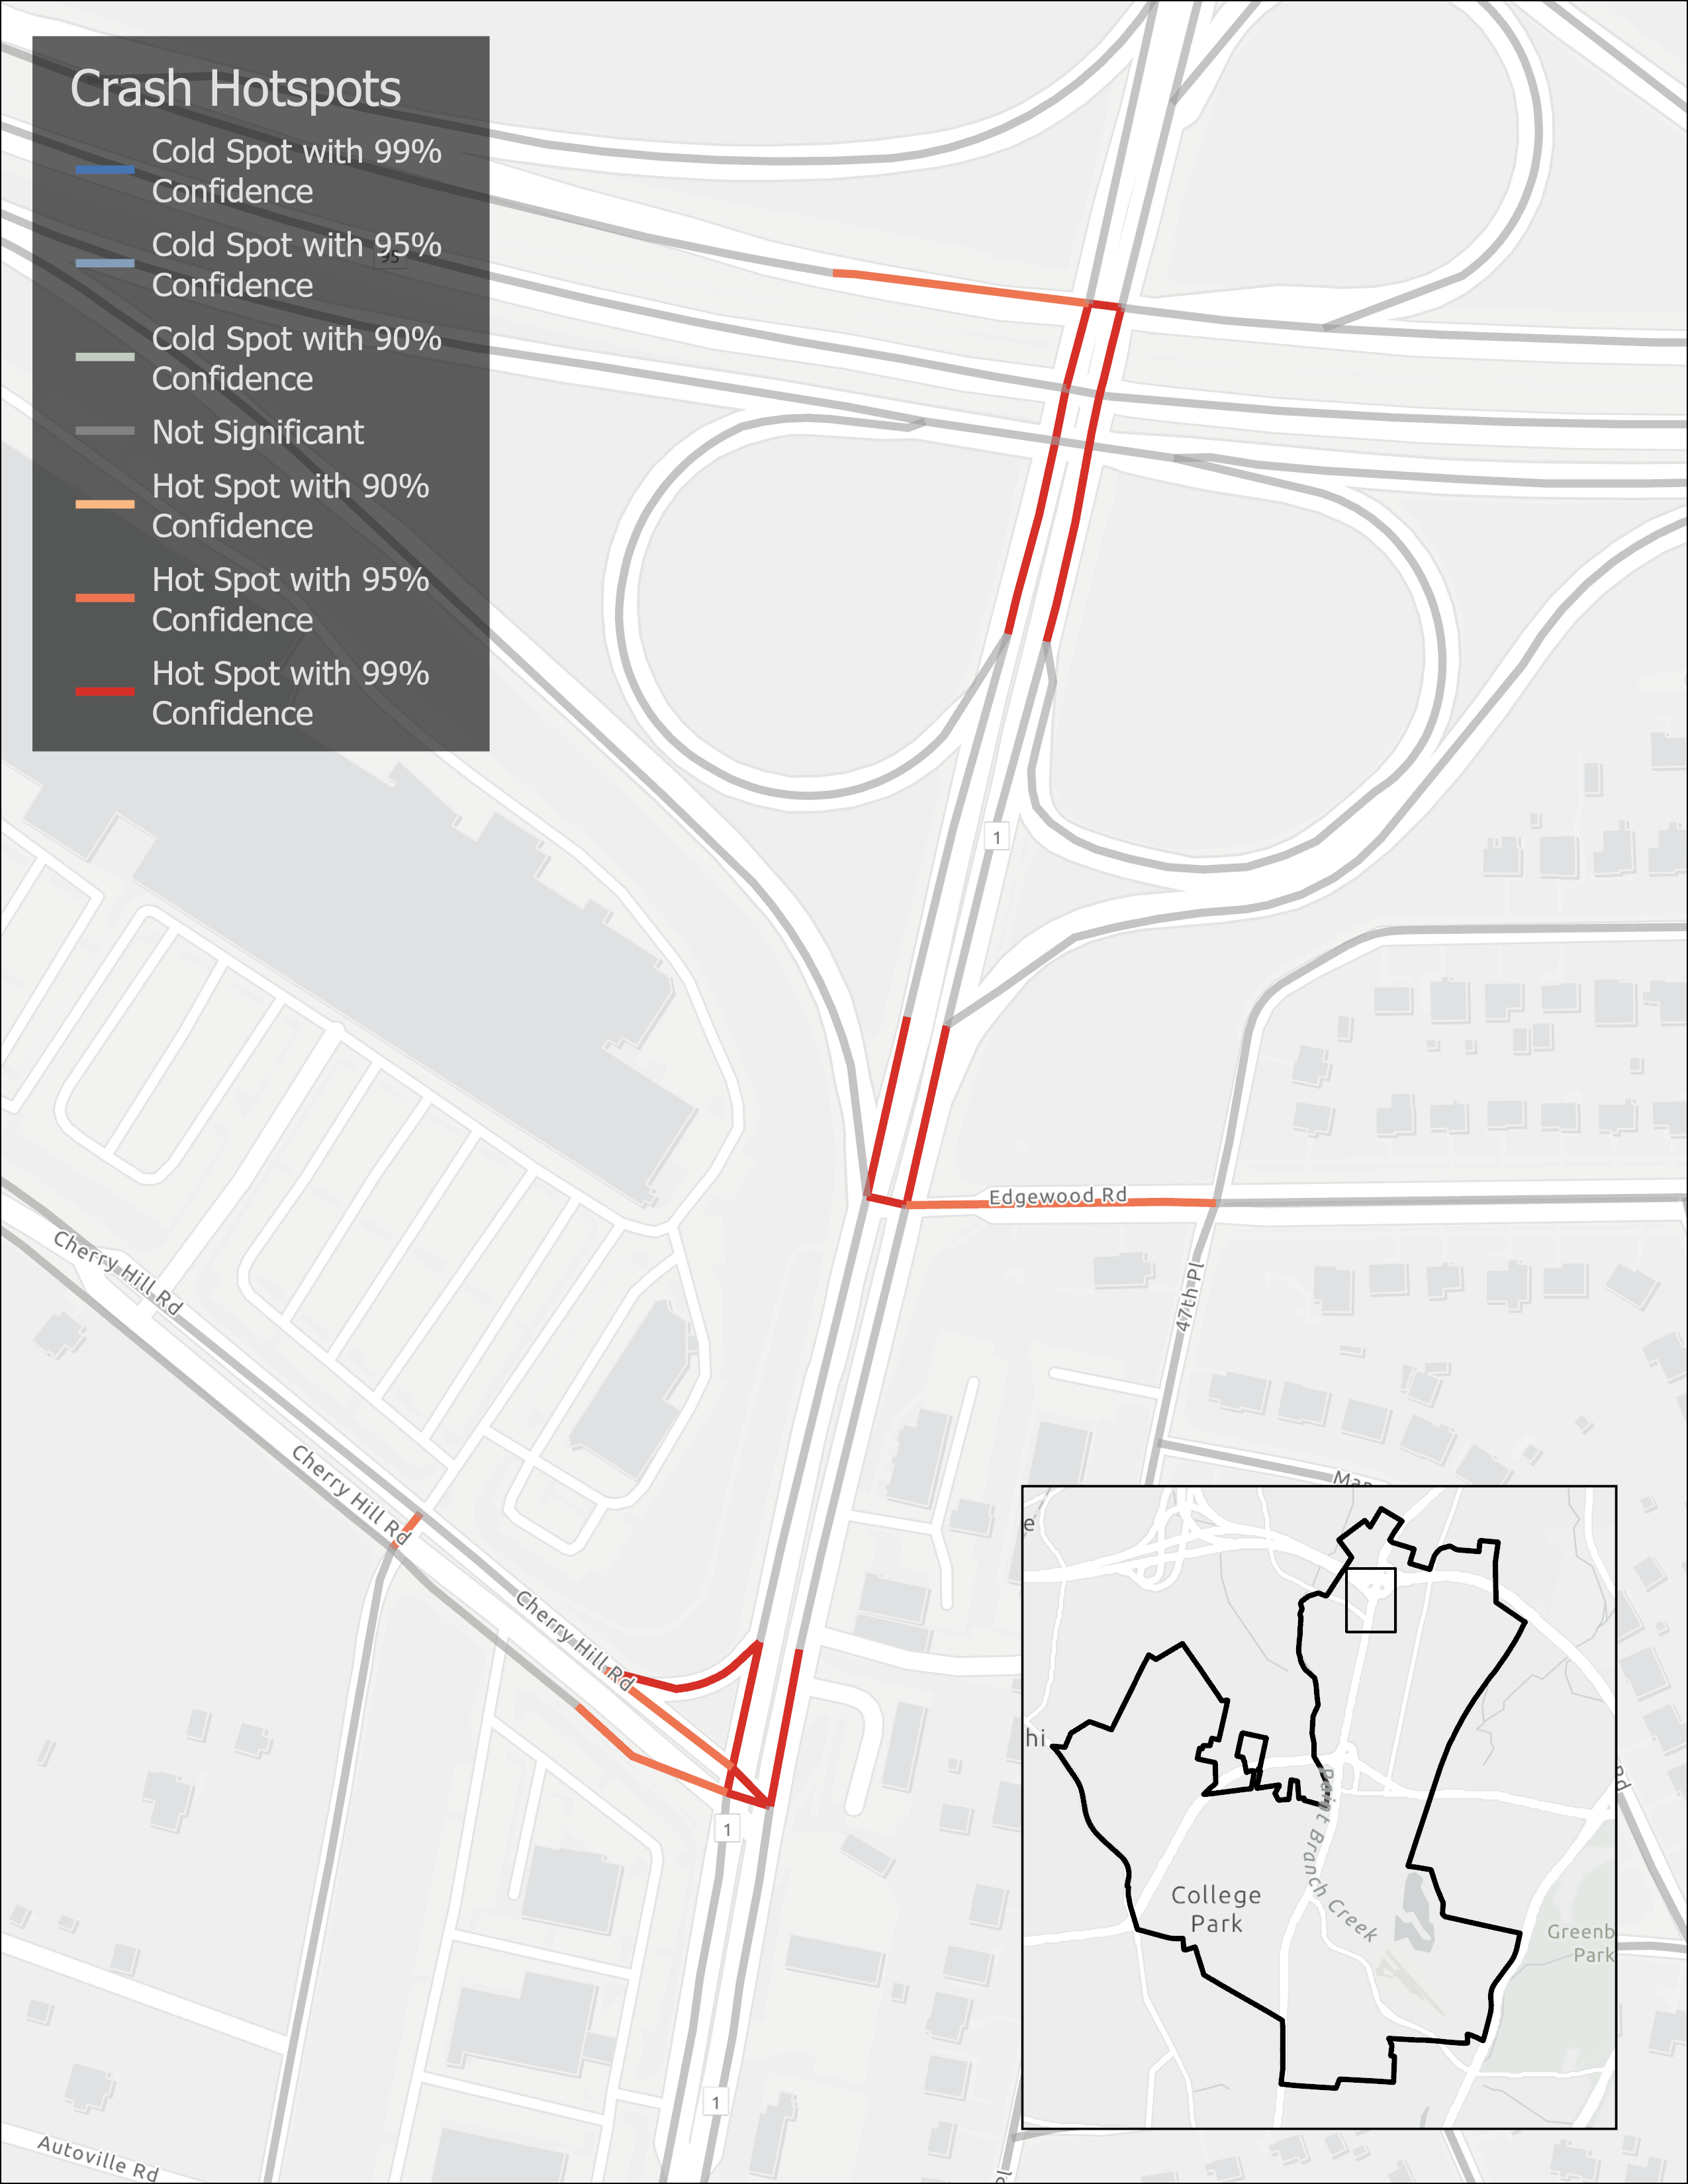
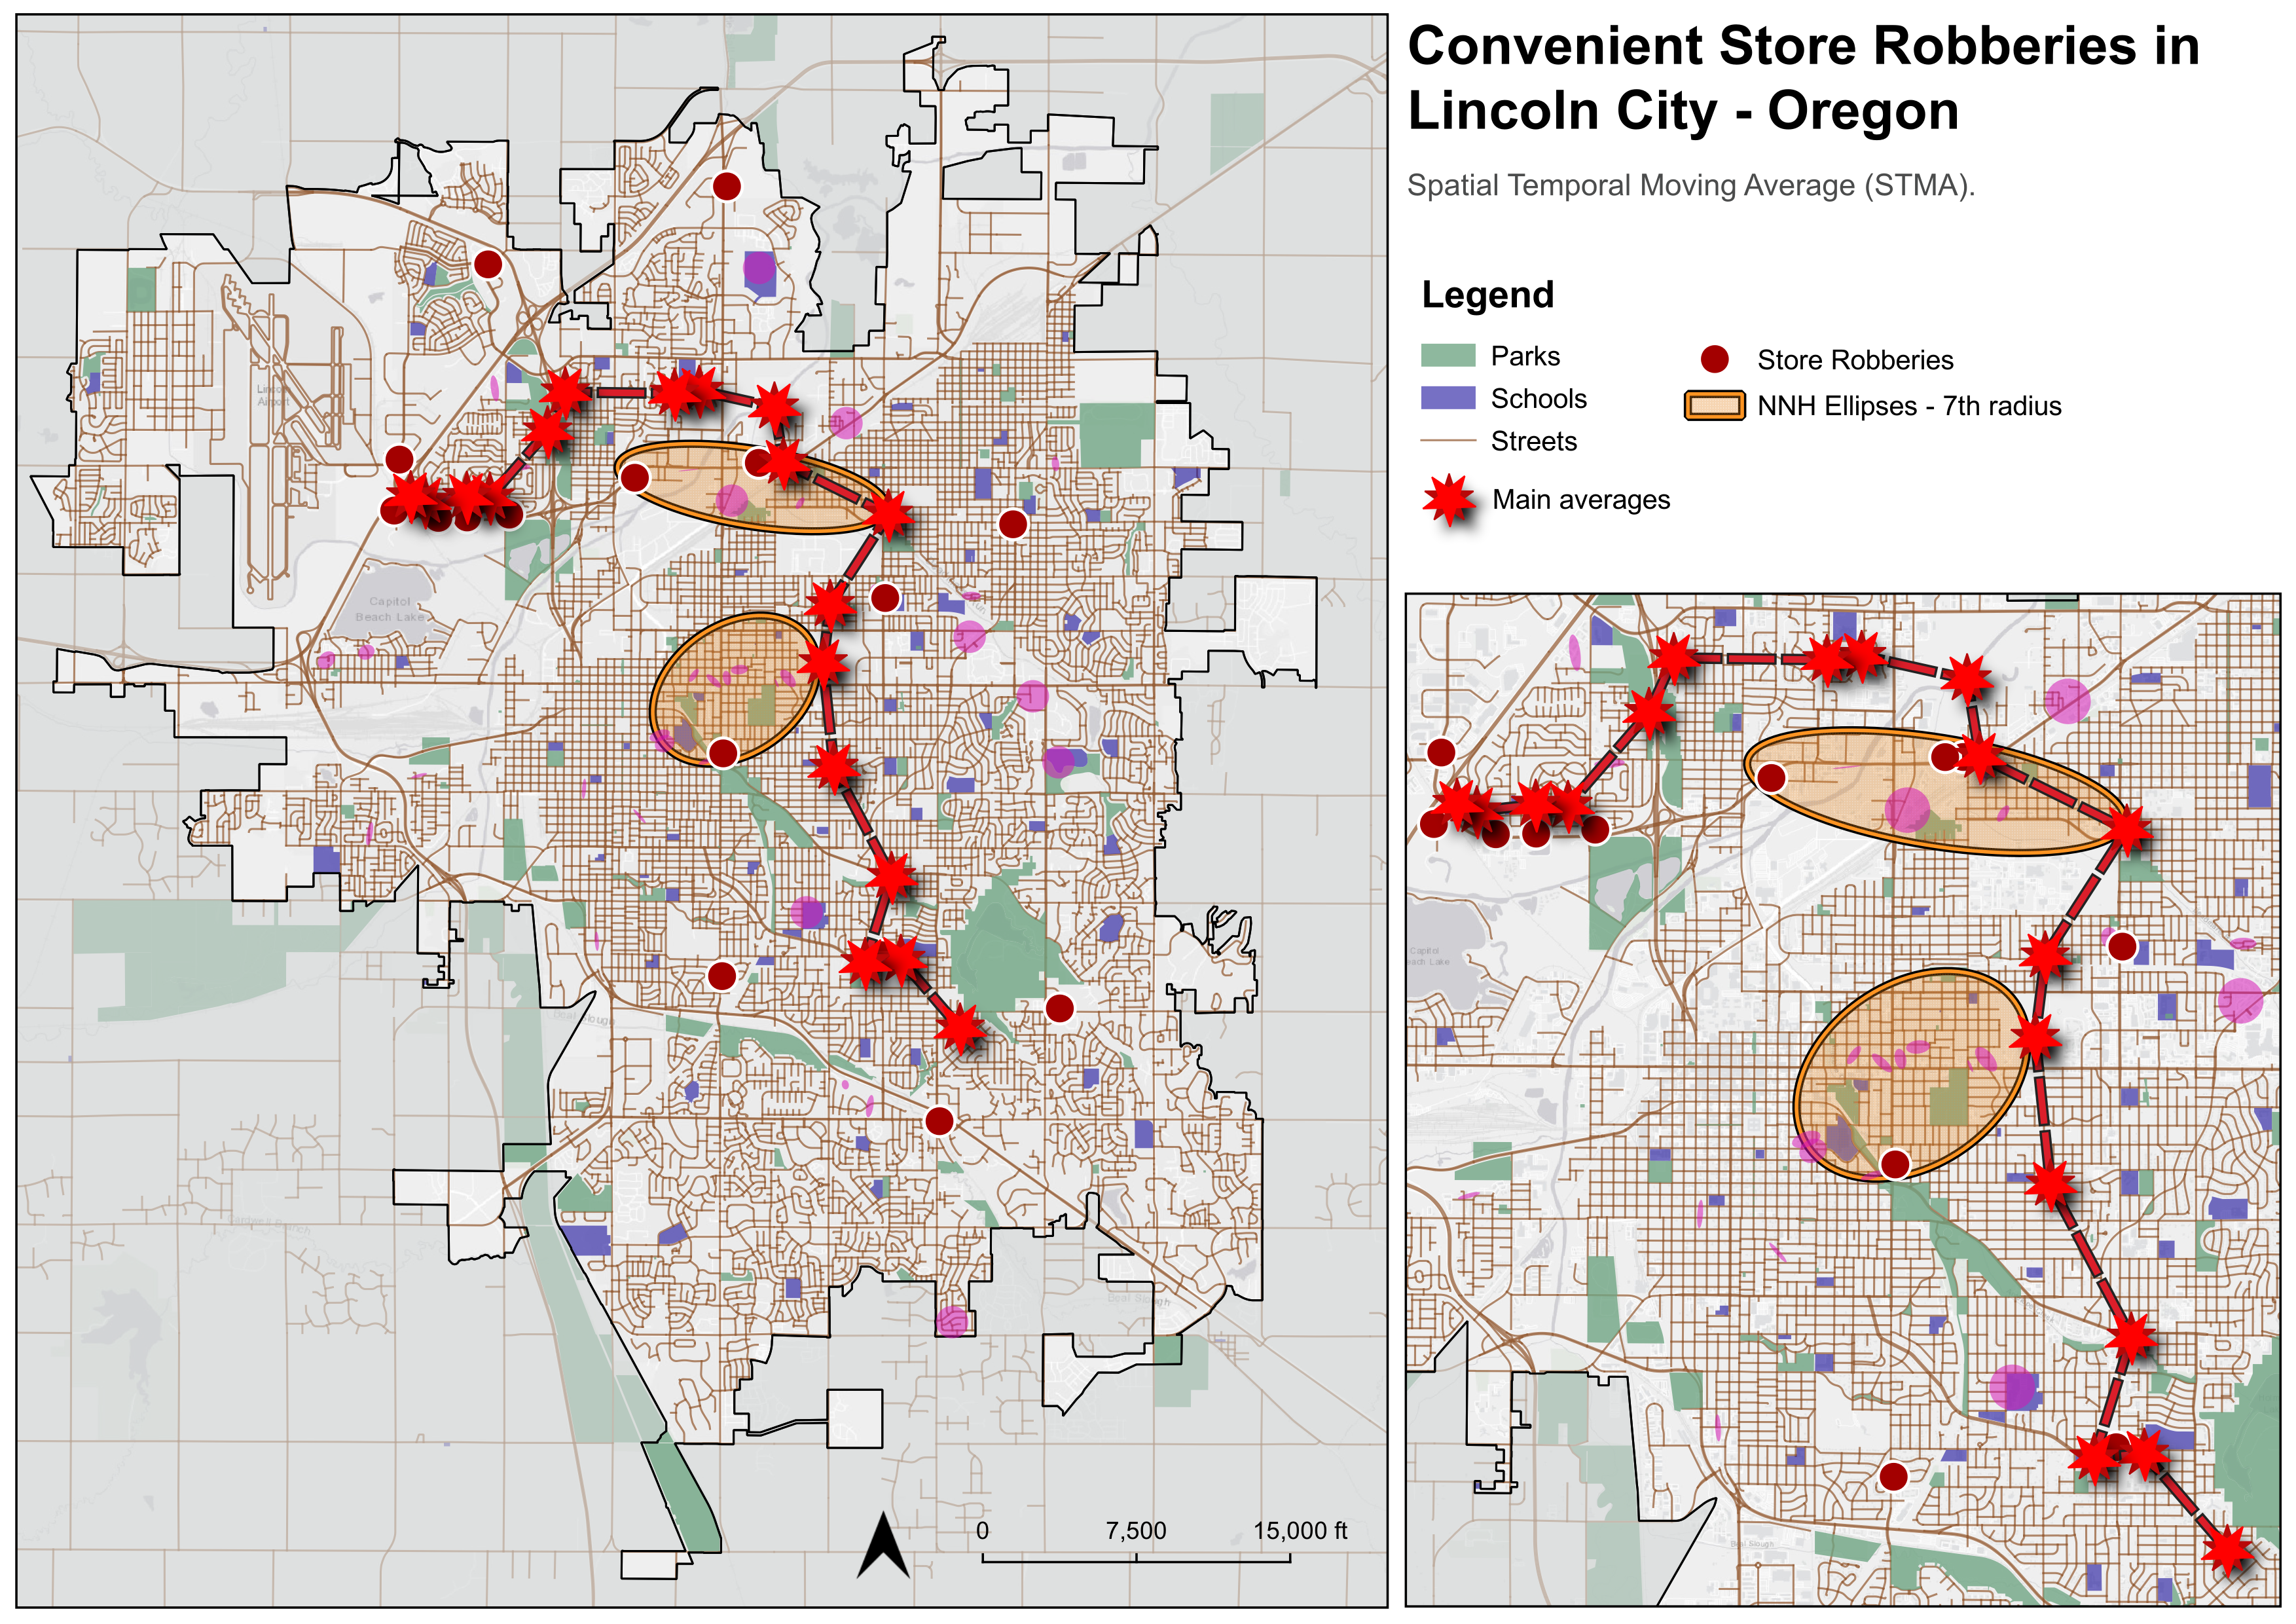
An automated ArcPy toolbox designed for urban safety engineering. It streamlines the identification of statistically significant (Getis-Ord Gi*) crash clusters, reducing data preparation time by 80%.